Contributors from the popular ultimate website UltiWorld analyzed the NexGen 2012 games using a newly developed spatial program for generating spatial-linked ultimate data called Ultiapps. Ultiapps allows users to generate spatial data on the locations of throws, catches, and turnovers which can be used to map the movement of the disc across the field. Of course, Ultiapps also allows you to view the results of traditional statistical categories like goals and assists, as well.
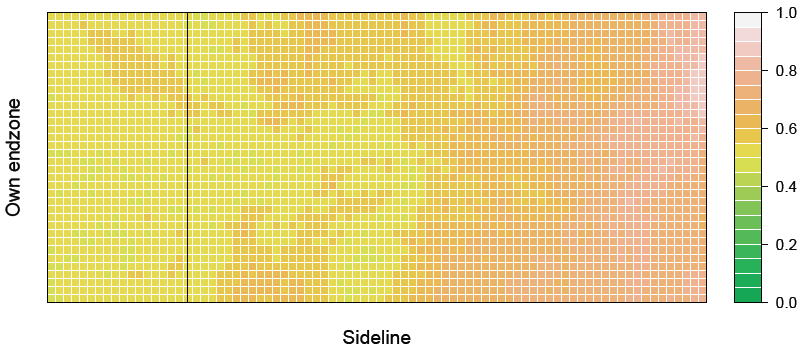
The really interesting part of this to me is the analysis the authors have developed, starting with this online article. What is really neat about this is the scoring probability maps that were created which show the probability that the possession will result in a goal for NexGen given that the disc is located at a given location on the field.

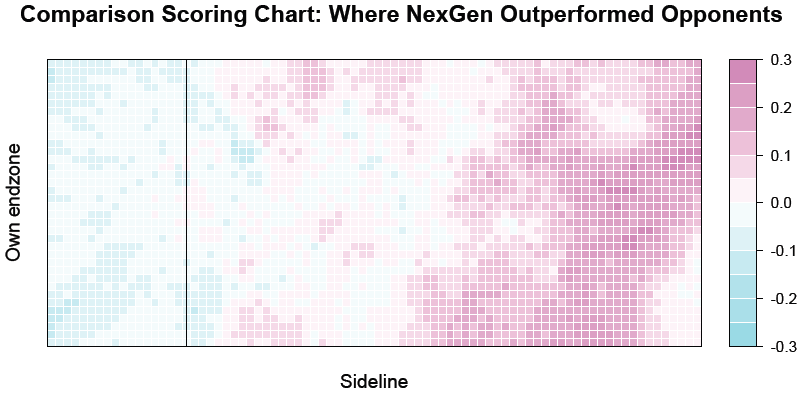
With this map you can see some neat trends, for instance, the probability of scoring seems to favor getting the disc to the right-hand sideline. The authors also compiled the same map for NexGen opponents which facilitated spatial analysis of the differences in effectiveness at scoring from different locations between NexGen and the teams they play against. Purple areas in the map below show where NexGen was more effective, while blue areas are where opponents were more effective.

The methods for deriving these scoring probability maps are outlined in a more technical article found here, that the authors have submitted are presenting at an upcoming machine learning conference.
This idea is really neat, and it relates nicely to some work I am currently looking at extending the concepts of shot location in evaluating goalies in ice hockey to an improved shooting percentage model. It would also be neat to examine the raw probability of scoring on a single throw maps for comparison. This would decrease the number of data points considerably, but would be interesting in terms of looking at teams huck success etc. Finally, as the authors suggest, incorporating some ancillary variables, for example, force or wind conditions, could really improve the usability of this type of spatial analysis by the ultimate community.
Nice work!